Vancouver Housing Market, October 2026: Buyers and Sellers Step Back
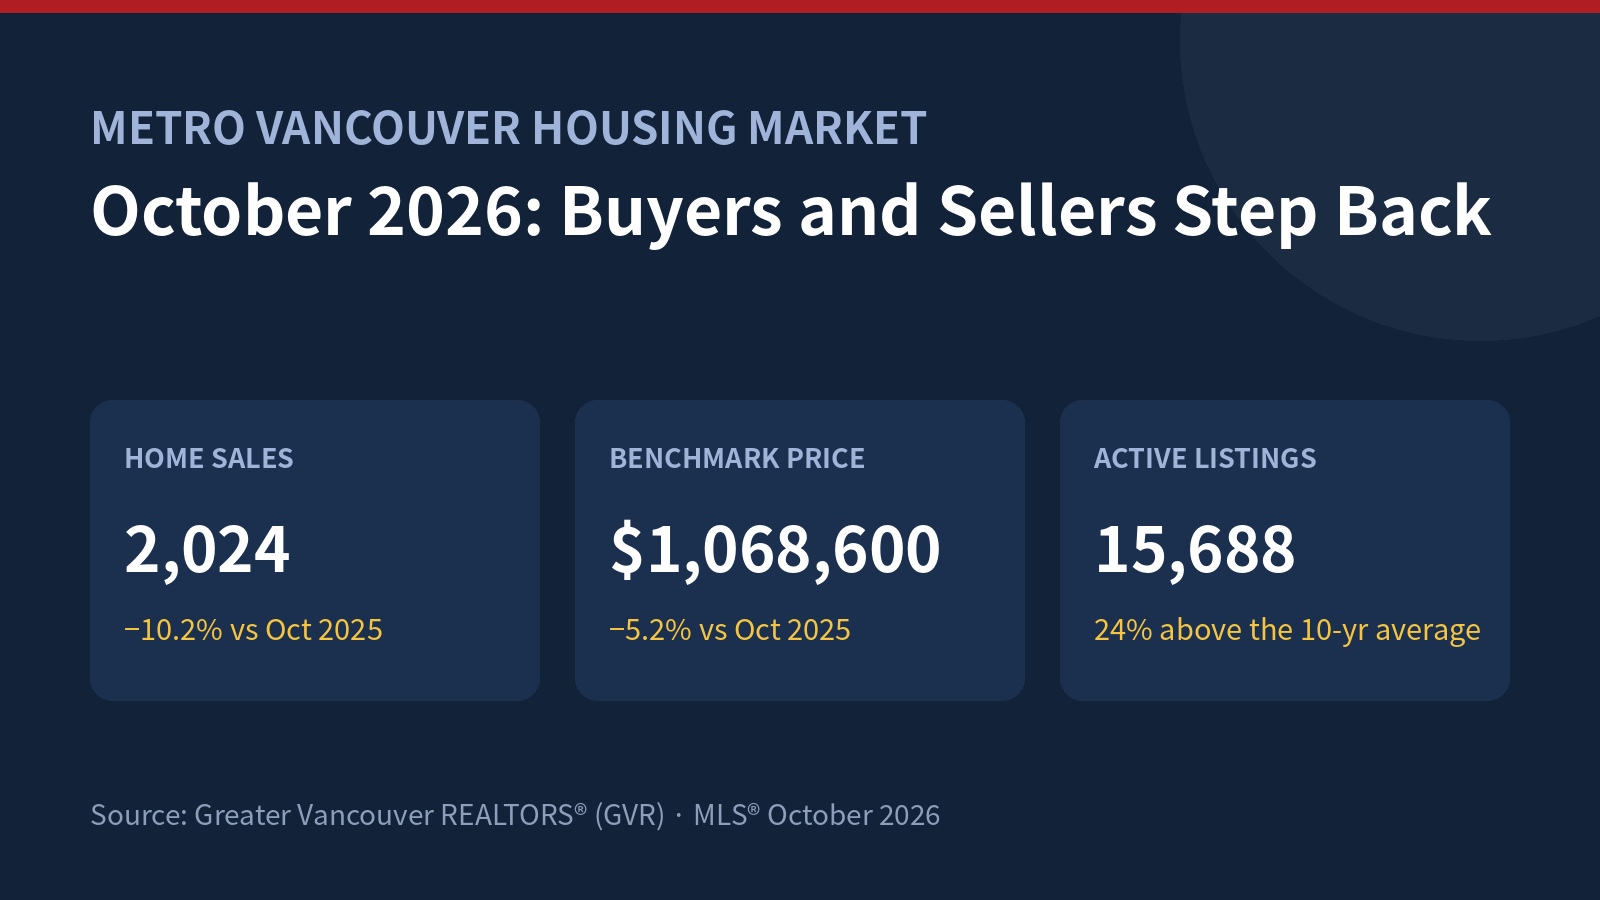
October was a wait-and-see month for Metro Vancouver real estate. Home sales totalled 2,024 — down 10.2 per cent from October 2025 and 22.5 per cent below the 10-year seasonal average. GVR’s chief economist Andrew Lis pointed to a month full of distractions, including a somewhat surprising Bank of Canada rate hike and a snap provincial election, saying buyers and sellers took “a step back in October to recalibrate.” The four charts below tell the story.
Sales and new listings both pulled back about 10%
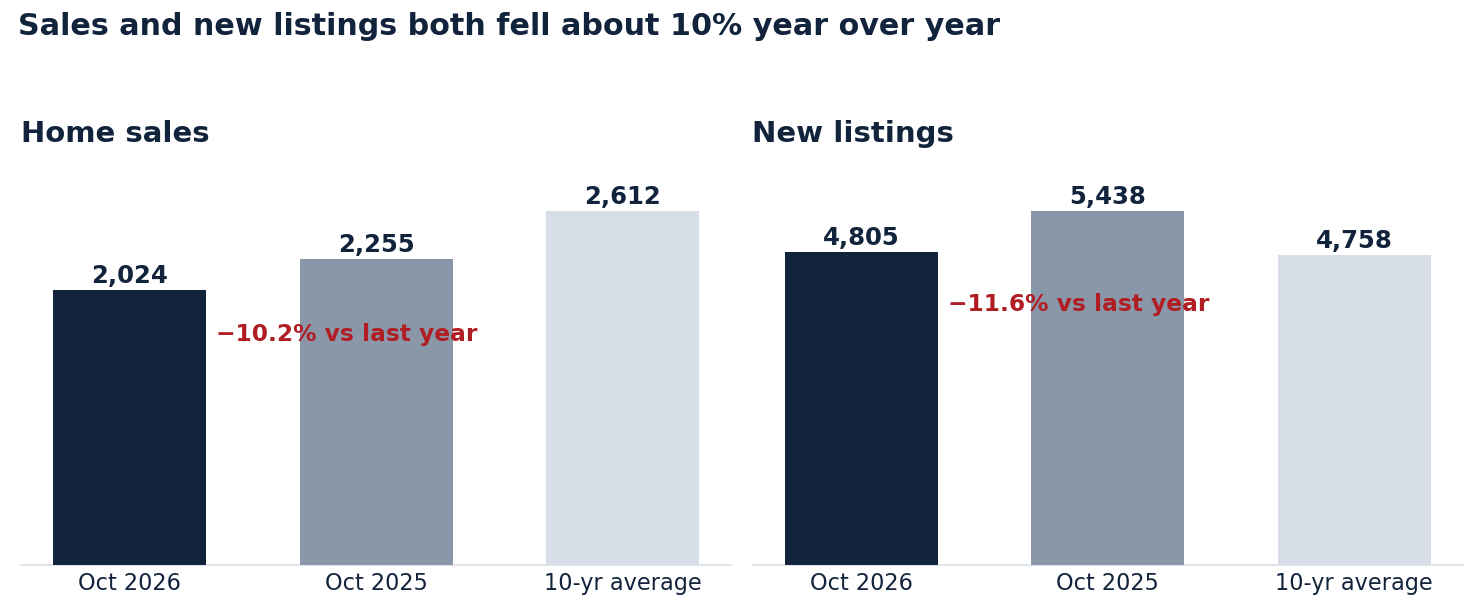
Sellers hesitated too: 4,805 homes were newly listed, down 11.6 per cent year over year but still 1 per cent above the 10-year seasonal average. With 15,688 properties now listed for sale — 24 per cent above the 10-year average — buyers who are ready to act have more choice than they’ve had in years.
Prices: down across the board
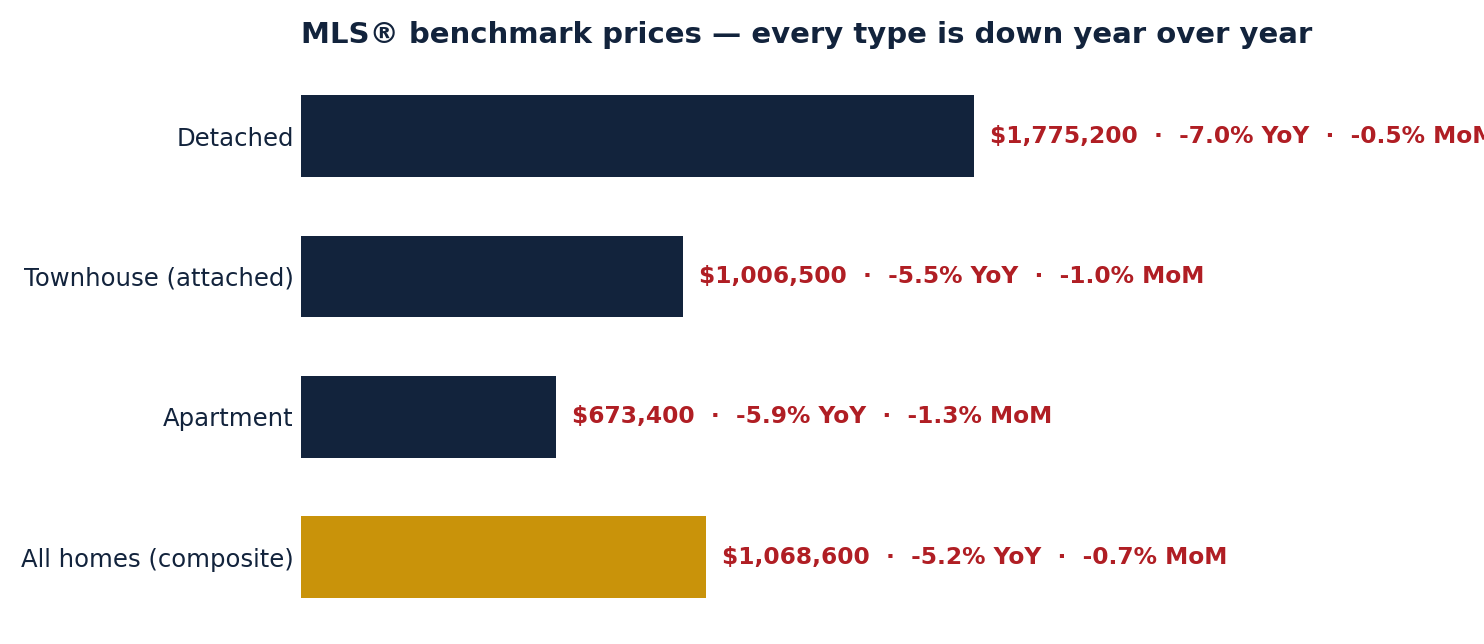
The composite benchmark price for all residential properties is now $1,068,600, down 5.2 per cent over the year and 0.7 per cent from September. Detached homes saw the steepest annual price drop (−7.0 per cent, to $1,775,200). Apartments were the softest segment for sales — 892 units sold, down 16.7 per cent — while townhouse sales held up best, down just 1.9 per cent (468 sales) at a $1,006,500 benchmark.
The ratio says: balanced, leaning soft
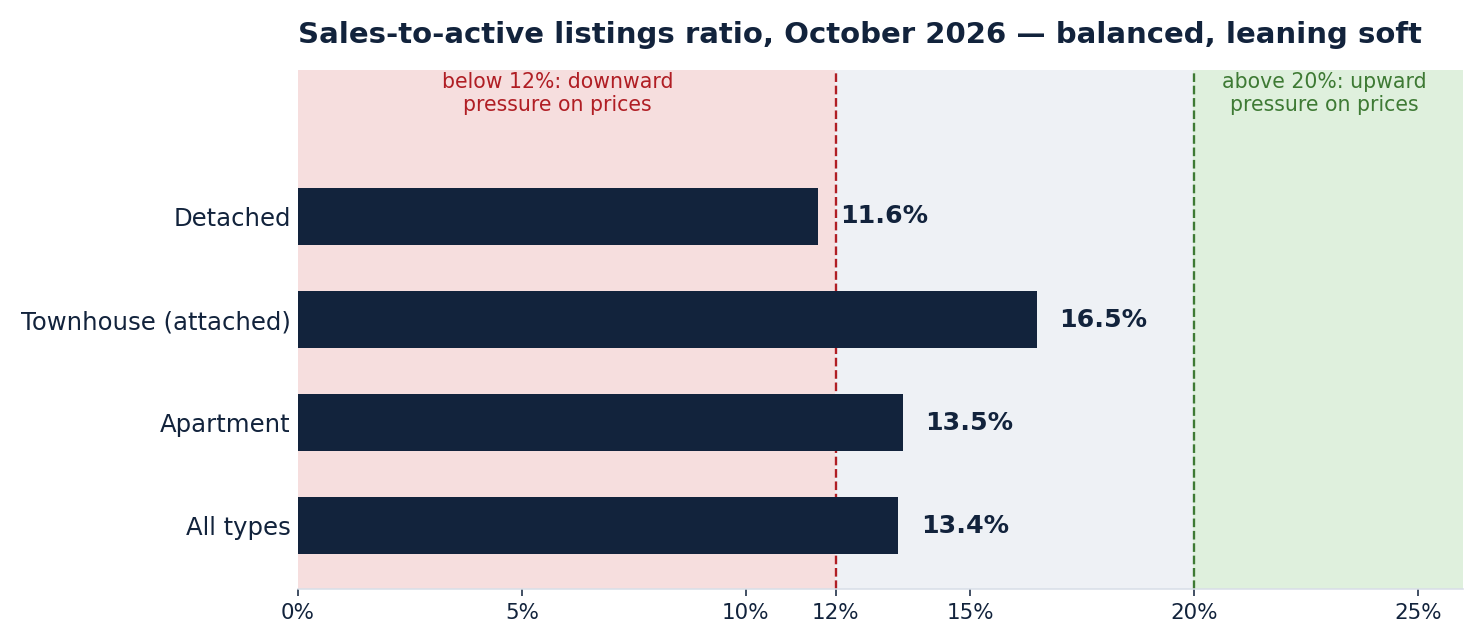
At 13.4 per cent overall, the market sits in balanced territory — but detached homes, at 11.6 per cent, are already just under the 12 per cent line where downward price pressure typically builds. Townhouses are the healthiest segment at 16.5 per cent.
What I’m watching
- Rate holds expiring. GVR notes some buyers may step in to use pre-approvals locked before the hike, even as markets price in a slight chance of another quarter-point hike in December.
- Selection vs. rates. Prices have edged lower all year, but higher borrowing costs have eroded much of that affordability gain — Lis calls it “one step forward, one step back.”
- For sellers: with this much inventory, pricing to today’s benchmark — not last year’s — is what gets a home sold. How I price and sell homes in this market.
- For buyers: 15,688 active listings is real negotiating room, especially in apartments and detached. Start with current Vancouver West listings or browse neighbourhood guides.
Want the numbers for your street or your building? I’m happy to run them — Jack Zhu, RE/MAX Select Properties, 604-889-1640.
Data source: Greater Vancouver REALTORS® (GVR), MLS® Home Price Index and October 2026 residential sales statistics for Metro Vancouver.